Year-on-YoY change in sales (stores 13 months old)
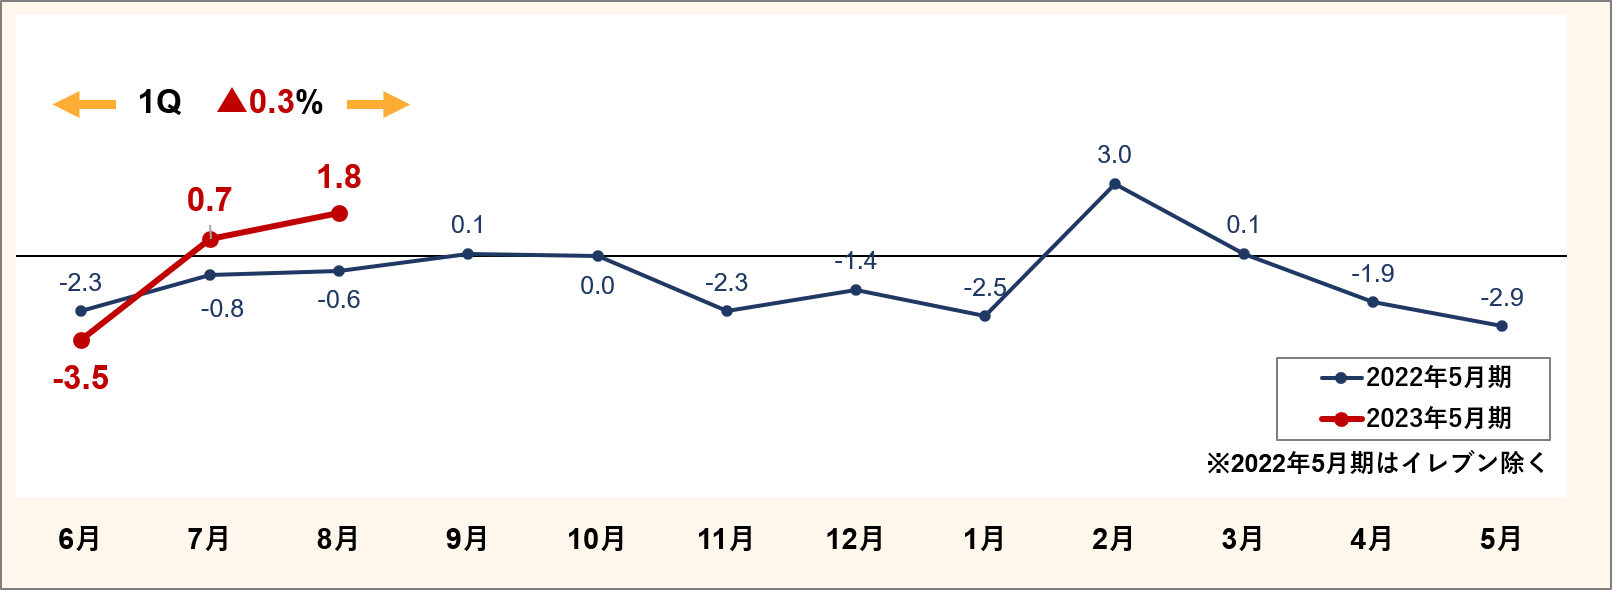
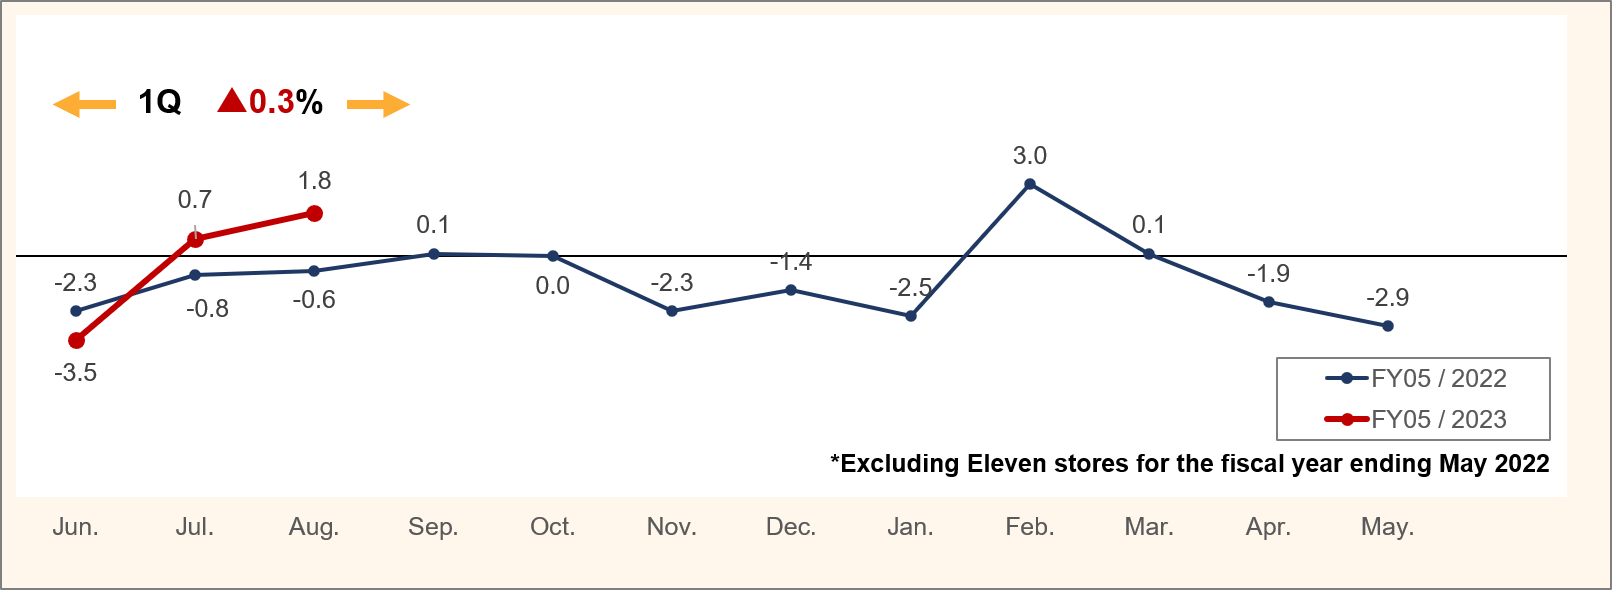


previous fiscal year
Current term